샤플 이용료 80% 지원 받기

Retail KPIs are measurable values that track your store's performance across sales, customer experience, inventory, and operations. The most critical KPIs for store managers include sales per square foot, conversion rate, inventory turnover, and customer lifetime value. Without proper KPI tracking, stores operate blindly and miss critical opportunities for growth and profitability.
Retail KPIs (Key Performance Indicators) are specific metrics that measure how effectively your store achieves business objectives. Unlike regular metrics that simply report numbers, KPIs directly connect to strategic goals and help you make data-driven decisions that impact your bottom line.
The difference between KPIs and regular metrics lies in their strategic importance. Regular metrics might track daily foot traffic, while a KPI measures conversion rate – the percentage of visitors who actually make purchases. KPIs answer critical business questions: Are we growing profitably? Are customers satisfied? Is our inventory optimized?
Stores without proper KPI tracking face serious consequences. You can't identify declining trends until it's too late, miss peak selling opportunities, and waste resources on ineffective strategies. Many store managers discover inventory issues only during physical counts, losing weeks of potential sales due to stockouts or overstock situations.
Sales KPIs reveal how effectively your store converts space, traffic, and inventory into revenue. These metrics directly impact your profitability and growth trajectory.
Sales Per Square Foot Formula and Benchmarks
Sales per square foot = Total sales ÷ Retail floor space
This KPI measures how efficiently you're using your physical space. High-performing retail stores typically achieve $200-400 per square foot annually, though this varies significantly by industry. Fashion retailers often see $150-300, while electronics stores might reach $400-600.
Average Transaction Value (ATV) Tracking
ATV = Total sales ÷ Number of transactions
Increasing ATV often proves more cost-effective than attracting new customers. Track ATV weekly to identify upselling opportunities and seasonal trends. Staff training on product bundling and cross-selling can boost ATV by 15-25% within months.
Conversion Rate: From Browsers to Buyers
Conversion rate = (Number of purchases ÷ Store visitors) × 100
Industry benchmarks vary, but most retail stores should target 2-5% conversion rates. Low conversion rates often indicate poor product placement, inadequate staff training, or pricing issues. High-converting stores focus on greeting customers within 30 seconds and understanding their needs quickly.

Customer-focused KPIs predict long-term business sustainability. Acquiring new customers costs 5-7 times more than retaining existing ones, making retention metrics crucial for profitability.
Customer Lifetime Value (CLV) Calculation
CLV = (Average order value × Purchase frequency × Customer lifespan)
Understanding CLV helps justify marketing spend and loyalty investments. Customers with CLV above $500 often warrant personalized attention and exclusive offers. Track CLV by customer segments to identify your most valuable demographics.
Repeat Purchase Rate and Loyalty Metrics
Repeat purchase rate = (Customers who bought 2+ times ÷ Total customers) × 100
Healthy retail businesses maintain 20-30% repeat purchase rates. Low rates suggest product quality issues, poor customer service, or inadequate follow-up. Implement email marketing and loyalty programs to boost repeat business.
Net Promoter Score (NPS) in Retail Context
NPS measures customer satisfaction through a simple question: "How likely are you to recommend our store?" Scores above 50 indicate strong customer loyalty, while negative scores signal serious service problems requiring immediate attention.
Inventory KPIs prevent the dual disasters of stockouts and excess inventory. Poor inventory management can reduce profits by 20-30% through lost sales and markdowns.
Inventory Turnover Rate and Stock Health
Inventory turnover = Cost of goods sold ÷ Average inventory value
Most retail categories should achieve 4-12 annual inventory turns. Fashion retailers need higher turnover (8-12), while furniture stores typically see 2-4 turns. Low turnover indicates slow-moving inventory requiring promotional action.
Gross Margin Return on Investment (GMROI)
GMROI = Gross margin ÷ Average inventory investment
This KPI reveals which products generate the best returns on inventory investment. Target GMROI ratios above $3.00, meaning every dollar invested in inventory generates $3+ in gross margin annually.
Sell-Through Rate for Product Categories
Sell-through rate = (Units sold ÷ Units received) × 100
Track sell-through rates by category, brand, and season. Aim for 80-90% sell-through rates to minimize markdowns while maintaining adequate stock levels. Low sell-through rates signal buying errors or pricing problems.
Operational KPIs ensure your store runs profitably while maintaining service quality. These metrics directly impact your cost structure and competitive position.
Labor Cost Percentage and Productivity
Labor cost percentage = (Total labor costs ÷ Total sales) × 100
Most successful retail stores maintain labor costs between 10-15% of total sales. Higher percentages suggest overstaffing or low productivity, while extremely low percentages might indicate understaffing that hurts customer service.
Shrinkage Rate and Loss Prevention
Shrinkage rate = (Book inventory - Physical inventory) ÷ Book inventory × 100
Industry average shrinkage ranges from 1.5-2% of sales, but this varies by category. High shrinkage rates require immediate loss prevention measures, improved security systems, and staff training on theft prevention.
Store Traffic and Peak Hour Analysis
Understanding traffic patterns helps optimize staffing and promotional timing. Track hourly visitor counts to identify peak periods requiring additional staff coverage. Most retail stores see 60-70% of daily traffic during 4-6 peak hours.
Successful KPI implementation requires systematic approach, realistic targets, and team engagement. Start with 5-7 core KPIs rather than overwhelming your team with dozens of metrics.
Setting Realistic Benchmarks and Targets
Begin by establishing baseline measurements for each KPI. Set achievable monthly improvement targets of 5-10% rather than dramatic changes that discourage your team. Use industry benchmarks as reference points, but focus on consistent improvement from your starting position.
Creating KPI Dashboards That Drive Action
Effective dashboards display current performance, trends, and targets in easy-to-understand formats. Update key metrics daily and review comprehensive reports weekly with your team. Visual dashboards with color-coding help staff quickly identify areas needing attention.
Training Your Team on KPI Accountability
Every team member should understand how their actions impact store KPIs. Sales associates need to know how greeting customers affects conversion rates. Cashiers should understand how upselling impacts average transaction value. Regular training sessions keep KPI awareness high.
A. Small stores should focus on five essential KPIs: conversion rate (visitors to buyers), average transaction value, inventory turnover, gross margin, and customer repeat purchase rate. These metrics provide comprehensive insights into sales effectiveness, inventory health, and customer satisfaction without overwhelming limited resources.
A. Review sales KPIs daily, operational metrics weekly, and customer/inventory KPIs monthly. Daily reviews help identify immediate issues, weekly reviews guide staffing and promotional decisions, while monthly reviews inform strategic planning and inventory management decisions.
A. KPIs are metrics directly tied to business objectives and strategic goals, while regular metrics are simply measurements. For example, daily sales is a metric, but sales per square foot is a KPI because it measures space efficiency and guides strategic decisions about store layout and expansion.
A. Conversion rate = (Number of transactions ÷ Store visitors) × 100. Count unique visitors entering your store and divide by completed purchases. Most retail stores target 2-5% conversion rates, though this varies by industry and store type.
A. Good inventory turnover rates vary by category: fashion and electronics should achieve 8-12 turns annually, while furniture and appliances typically see 2-4 turns. Higher turnover indicates efficient inventory management and reduced carrying costs, but extremely high turnover might signal stock shortage issues.
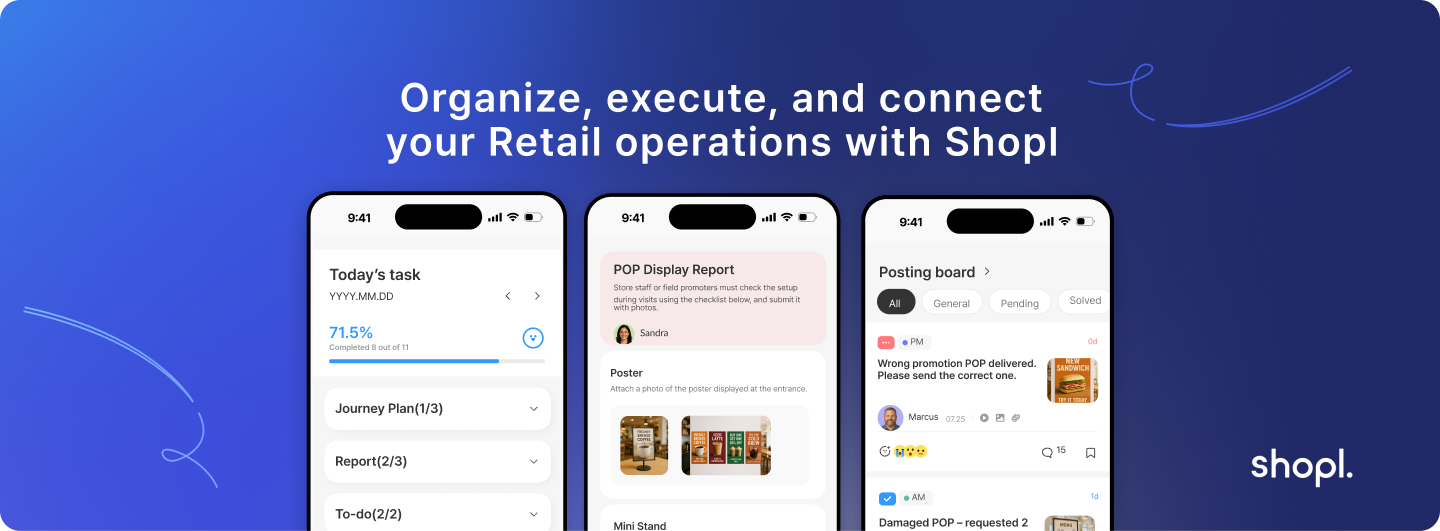
Shopl's integrated platform helps store managers track essential KPIs through real-time dashboards and automated reporting. Our system consolidates sales data, staff performance metrics, and operational indicators in one comprehensive view, eliminating the need to compile data from multiple sources. Learn more about how Shopl can streamline your KPI tracking at our features page.
By implementing systematic KPI tracking, store managers gain the insights needed to drive consistent profitability and growth. Focus on the metrics that directly impact your business goals, maintain regular review schedules, and ensure your entire team understands their role in achieving KPI targets. The stores that thrive in competitive retail environments are those that measure what matters and take action based on data-driven insights.